Initiate Coverage | Banking
November 28, 2016
Lakshmi Vilas Bank
BUY
CMP
`148
Initiating Coverage
Target Price
`174
Lakshmi Vilas Bank (LVB) is a south based private sector bank with major business
Investment Period
12 Months
(50.2%) concentrated in the state of Tamil Nadu. As of FY16, LVB has a network
of 460 branches and 910 ATMs, with business size of `45,250cr. LVB has beefed
Stock Info
up teams with lateral hiring from banks & NBFCs and implemented innovative
large scale technology for long term sustainability.
Sector
Banking
Focused & experience management to drive growth: At the end of CY2015, Axis
Market Cap (` cr)
2,650
Bank group executive, Mr. Parthasarathi Mukherjee, joined LVB as MD & CEO,
Beta
0.7
which was a sign of relief especially after the frequent exits in top management from
52 Week High / Low
169/78
2011-2015. Since then, LVB has successfully hired the top executives from other banks.
Avg. Daily Volume
79,946
Increasing mix of Retail/SME to drive credit: Over the next few years, the
Face Value (`)
10
management aim to scale up retail/SME portfolio from 43% (FY16) to 60%
(FY20); this should drive 18% loan CAGR over FY16-18. Within retail segment,
BSE Sensex
26,316
the bank intends to grow in mortgage and gradually get into two & four wheeler;
Nifty
8,114
while on SME, it will continue to focus on working capital financing. Considering
Reuters Code
LVLS.BO
the accelerated growth, management plans to raise capital (Tier-1) of ~`500cr.
Bloomberg Code
LVB@IN
Laying a sustainable foundation of CASA to boost NIM: LVB’s CASA ratio was at
14.9% (FY12) and has grown to 17.36% (FY16). Nevertheless, this is one of the
lowest CASA amongst regional banks. The new management targets to improve
CASA ratio by 2% every year for the next two-three years. LVB has taken a few
Shareholding Pattern (%)
steps: a) Offering higher interest rates (5-6%) vs. industry average (4%), b)
Promoters
9.7
Employing RM to garner salary A/C, c) On an average, addition of 70-80 branches
MF / Banks / Indian Fls
33.0
over the next three years, and d)Sales force incentivizes to mobilize liability products.
RoA booster - Focus fees income & non-funded business: LVB’s fees based
FII / NRIs / OCBs
8.7
income remained very low (0.5% of average assets over FY11-16), lower than
Indian Public / Others
48.7
close peer City Union bank (~0.75%). With extensive experience in corporate
banking, new MD has taken several steps to extend non-funded services to SME
such as treasury products, letter of credit, bank guarantees among others, etc. In
Abs. (%)
3m
1yr
3yr
addition to this, the third-party distribution will also contribute to the fees income.
Sensex
(5.5)
2.1
27.7
Asset quality: From the peak 3.4% (FY14), NPA declined to 1.3% (FY16) owing to
strengthening the credit underwriting and monitoring process. In 2QFY17, NPA
Lakshmi Vilas Bank
4.2
65.9
181.9
has increased to 1.87%.
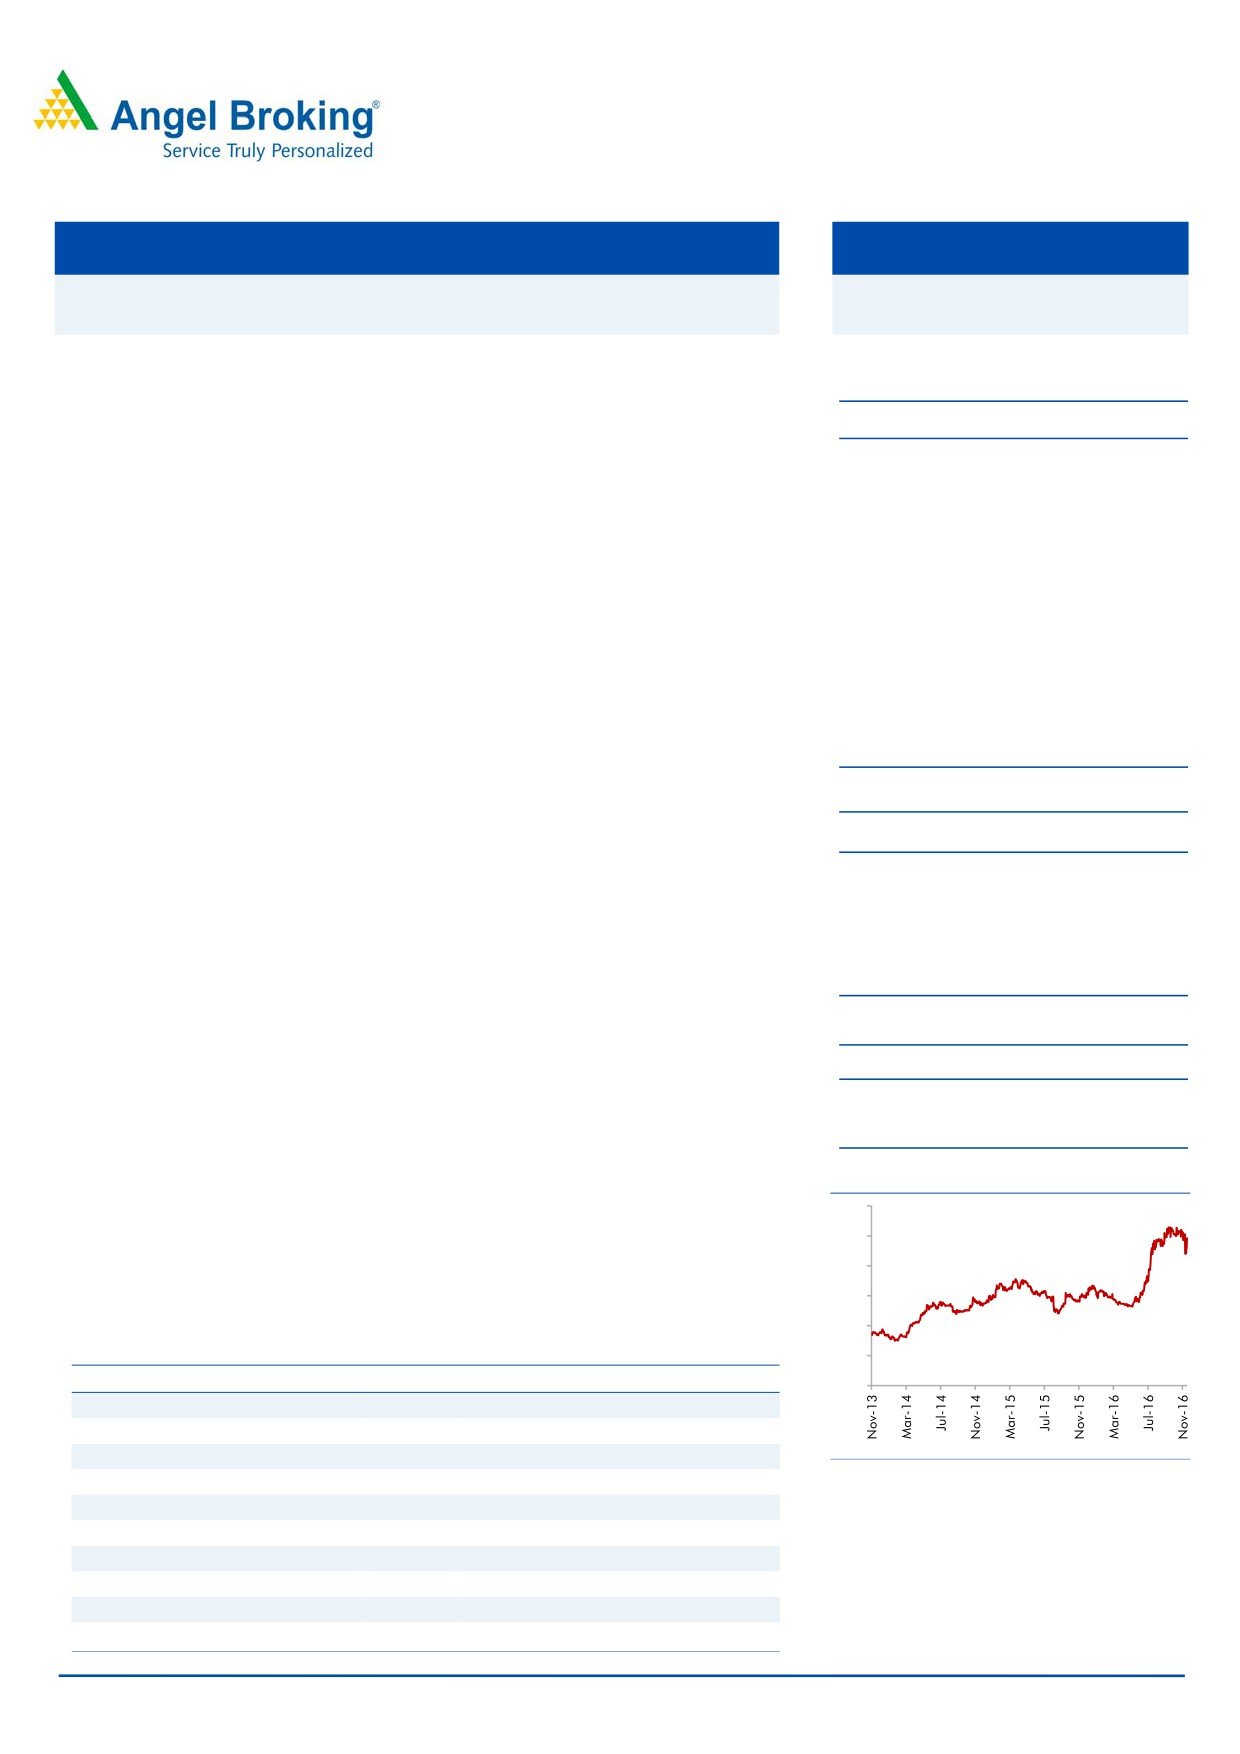
3-Year Daily Price Chart
Outlook & Valuation: We believe that scaling up of the liability franchise led by
180
CASA, higher contribution from other incomes and prudence approach to
150
alleviate bad loans will drive profitability and propel return ratio (FY18E -
ROE - 12.7% & RoA - 0.72). This can drive further re-rating. At the current market
120
price, the stock is trading at 1.25x its FY2018E BV of `116. We recommend a
90
BUY rating on the stock, with a target price of `174 (1.50x FY2018E BV).
60
Key financials
30
Y/E March (` cr)
FY2014
FY2015
FY2016
FY2017E
FY2018E
0
NII
486
527
645
777
914
% chg
24.0
8.4
22.5
20.4
17.6
Net Profit
60
132
181
205
254
Source: Company, Angel Research
% chg
(34)
120
36
13
24
NIM%
2.8
2.6
2.6
2.7
2.8
EPS
6
7
10
11
14
P/E
24
20
14
13
10
P/ABV
1.8
1.9
1.6
1.6
1.4
Jaikishan Parmar
RoA (%)
0.31
0.58
0.68
0.66
0.72
+91 22 3935 7600 Ext: 6810
RoE (%)
5.8
10.1
10.9
11.2
12.7
Source: Company, Angel Research; Note: CMP as of November 28, 2016
Please refer to important disclosures at the end of this report
1
Lakshmi Vilas Bank | Initiating Coverage
Focused & experience management to drive growth
After the exits of MDs - Mr. PM Somasundaram (FY11-12), Mr. KSR Anjaneyulu
(FY13-14), and Mr. Rakesh Sharma (FY14-15), Mr. Parthasarathi Mukherjee, Axis
Bank group executive, joined LVB as MD & CEO at the end of CY2015. Since the
induction of new MD & CEO, LVB has been able to attract well-diversified talent
baked by rich financial services experience from lenders including HDFC, SBI, Axis
Bank, Royal Bank of Scotland and RBL to achieve transformational journey - LVB
2.0. We believe LVB is now equipped with experienced and strong credential team
to run next phase of growth.
Mr.Parthasarathi Mukherjee - MD and CEO
Mukherjee was earlier with Axis Bank as group executive (corporate relationships
and international business). He was with the bank for nearly 21 years. Before that,
he worked for the State Bank of India (SBI) for nearly 12 years. His expertise lies in
corporate relationships and international business.
Mr. NS Venkatesh - Executive Director
Former Executive Director and CFO of IDBI bank, with 33 years of experience.
RVS Sridhar - Chief risk Officer
His past experience was with SBI and AXIS bank. At Axis bank, he served for
21 years in Treasury, operation and Audit.
Mr. Govind Ravindran - Head Consumer Lending
Madhusudhana Rao - Chief Customer Service
Peeush Jain - Head of Business
B Nedumaran - Human Resources
The management has drafted Vision documents for 2020 and 2026, labelled LVB
2.0, with targets on asset size, market share and shareholder returns.
Exhibit 1: LVB 2.0
FY 16
FY 20E
Number of Branches
460
1000
Total Assets (INR Bn)
287
650
Net Interest Margins (%)
2.8%
3.3%
Cost/Income Ratio
57.1%
48.7%
Gross NPA
2.0%
1.6%
Return on Assets
0.7%
1.2%
Return on Equity
11.7%
18.3%
Source: Company, Angel Research
November 28, 2016
2
Lakshmi Vilas Bank | Initiating Coverage
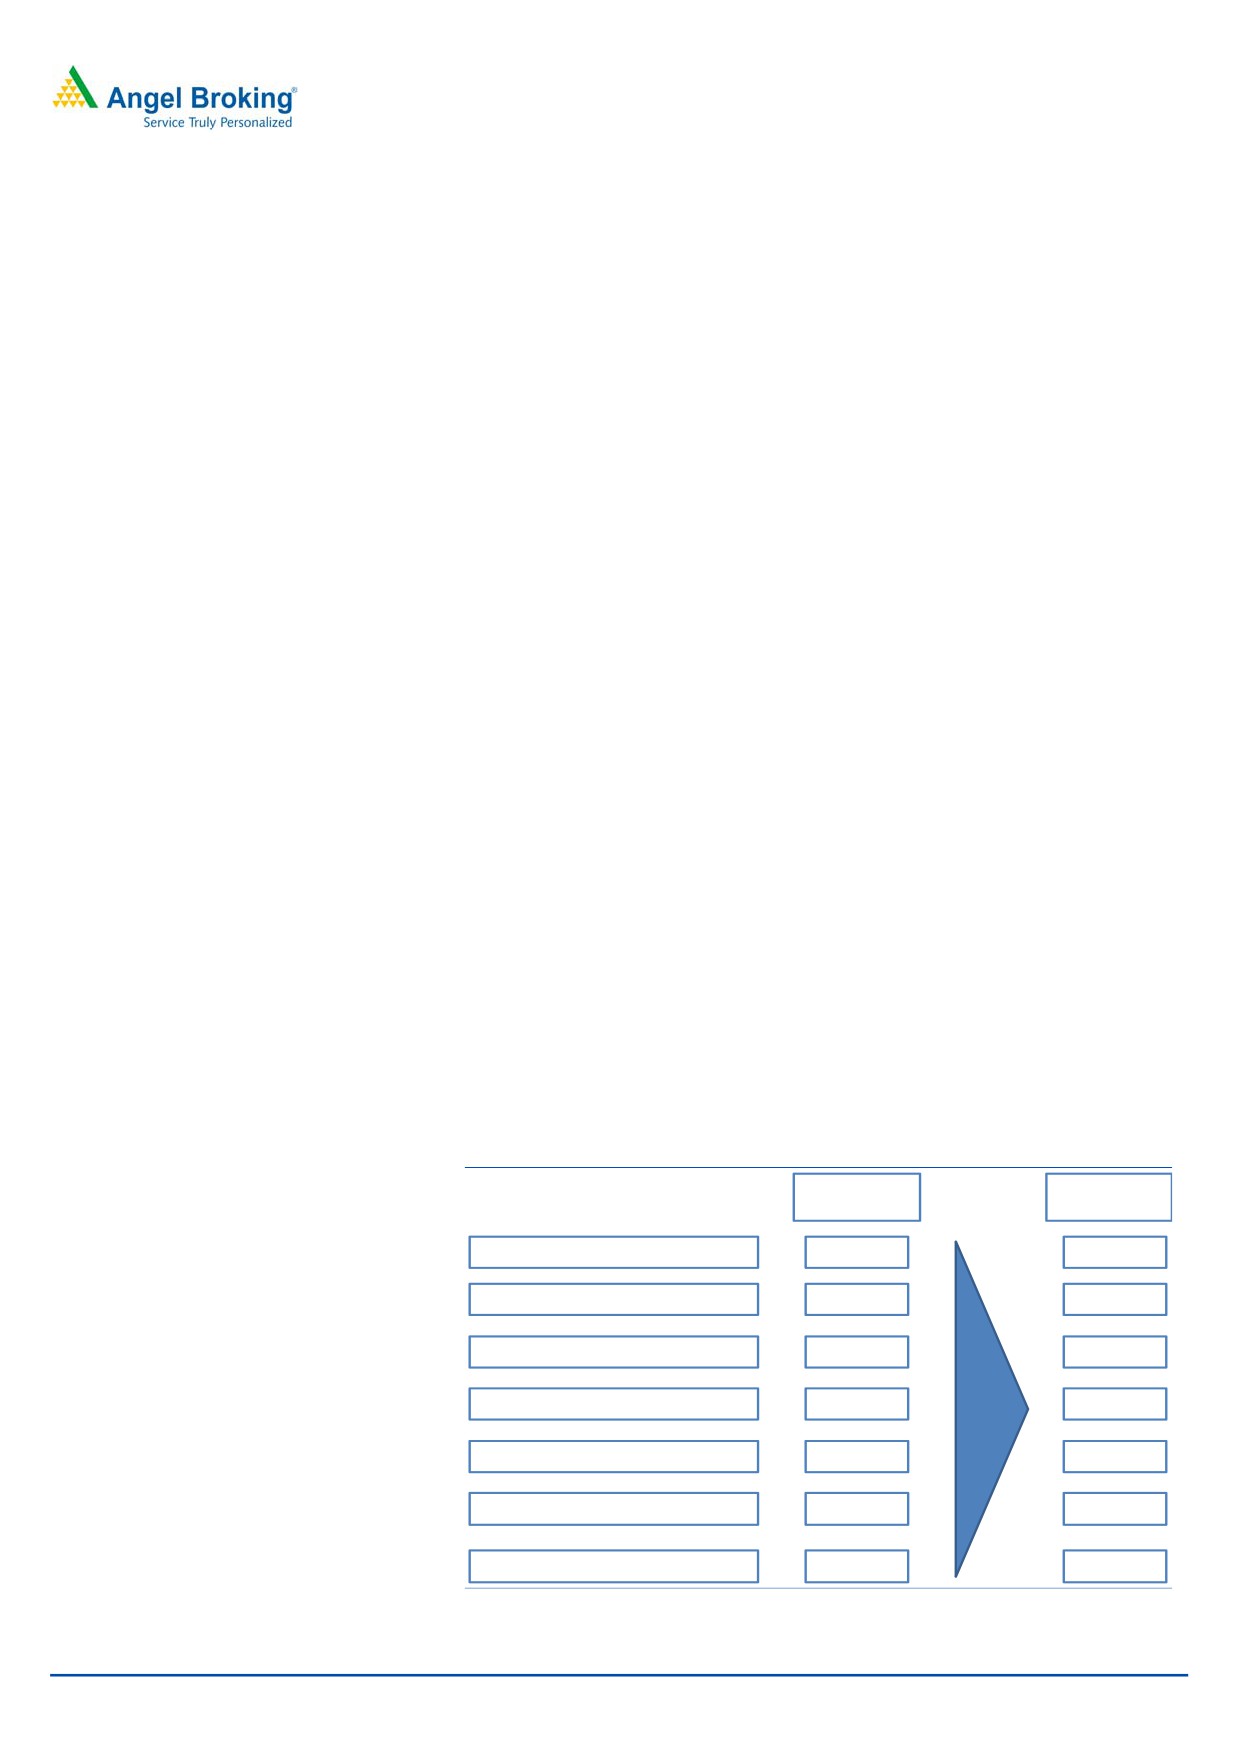
Exhibit 2: Strategic plan to accomplish LVB - 2.0
Sustainable
Growth
Target 10 years
CAGR of 20-25%.
CASA
Initial focus on
Focus on
deepening presence
increasing CASA
Credit
in focus geographies.
share through
branch specific
Building brand for
Strengthing
initiatives.
phased expansion in
Customer
credit and risk
contiguous markets
Segmentatio
functions.
Strong early
for wider presence.
progress.
n
Granular
Separation
customer for
of clients
focused
acquisition
Team
strategies
from credit
Focus to
appraisal.
augment skills
Retail:Initial
and capabilities.
focus on
mortgage and
Centralization
Strategic
vehicles; other
of wholesale
additions to fill
products in
credit
gaps.
phased manner.
Strengthing HR
MSME:
practices
Regional focus
Source: Company, Angel Research
Increasing mix of Retail/SME to drive credit: Over the next few years, the
management intends to ramp up retail/SME portfolio from 41.5% (FY16) to 60%
(FY20). This should drive 18% loan CAGR over the period of FY16-18. We believe
higher yielding retail portion would go up from current 13% (FY16) to 17.2%
(FY18), resulting retail book to grow at 30%+ CAGR over FY16-18. To attain this
high growth and gain retail proportion, bank has hired Mr. Govind Ravindran as
head of consumer and retail lending. Mr. Govind was working with HDFC for the
past 12 years and was handling Home/LAP business in Karnataka and Goa
region.
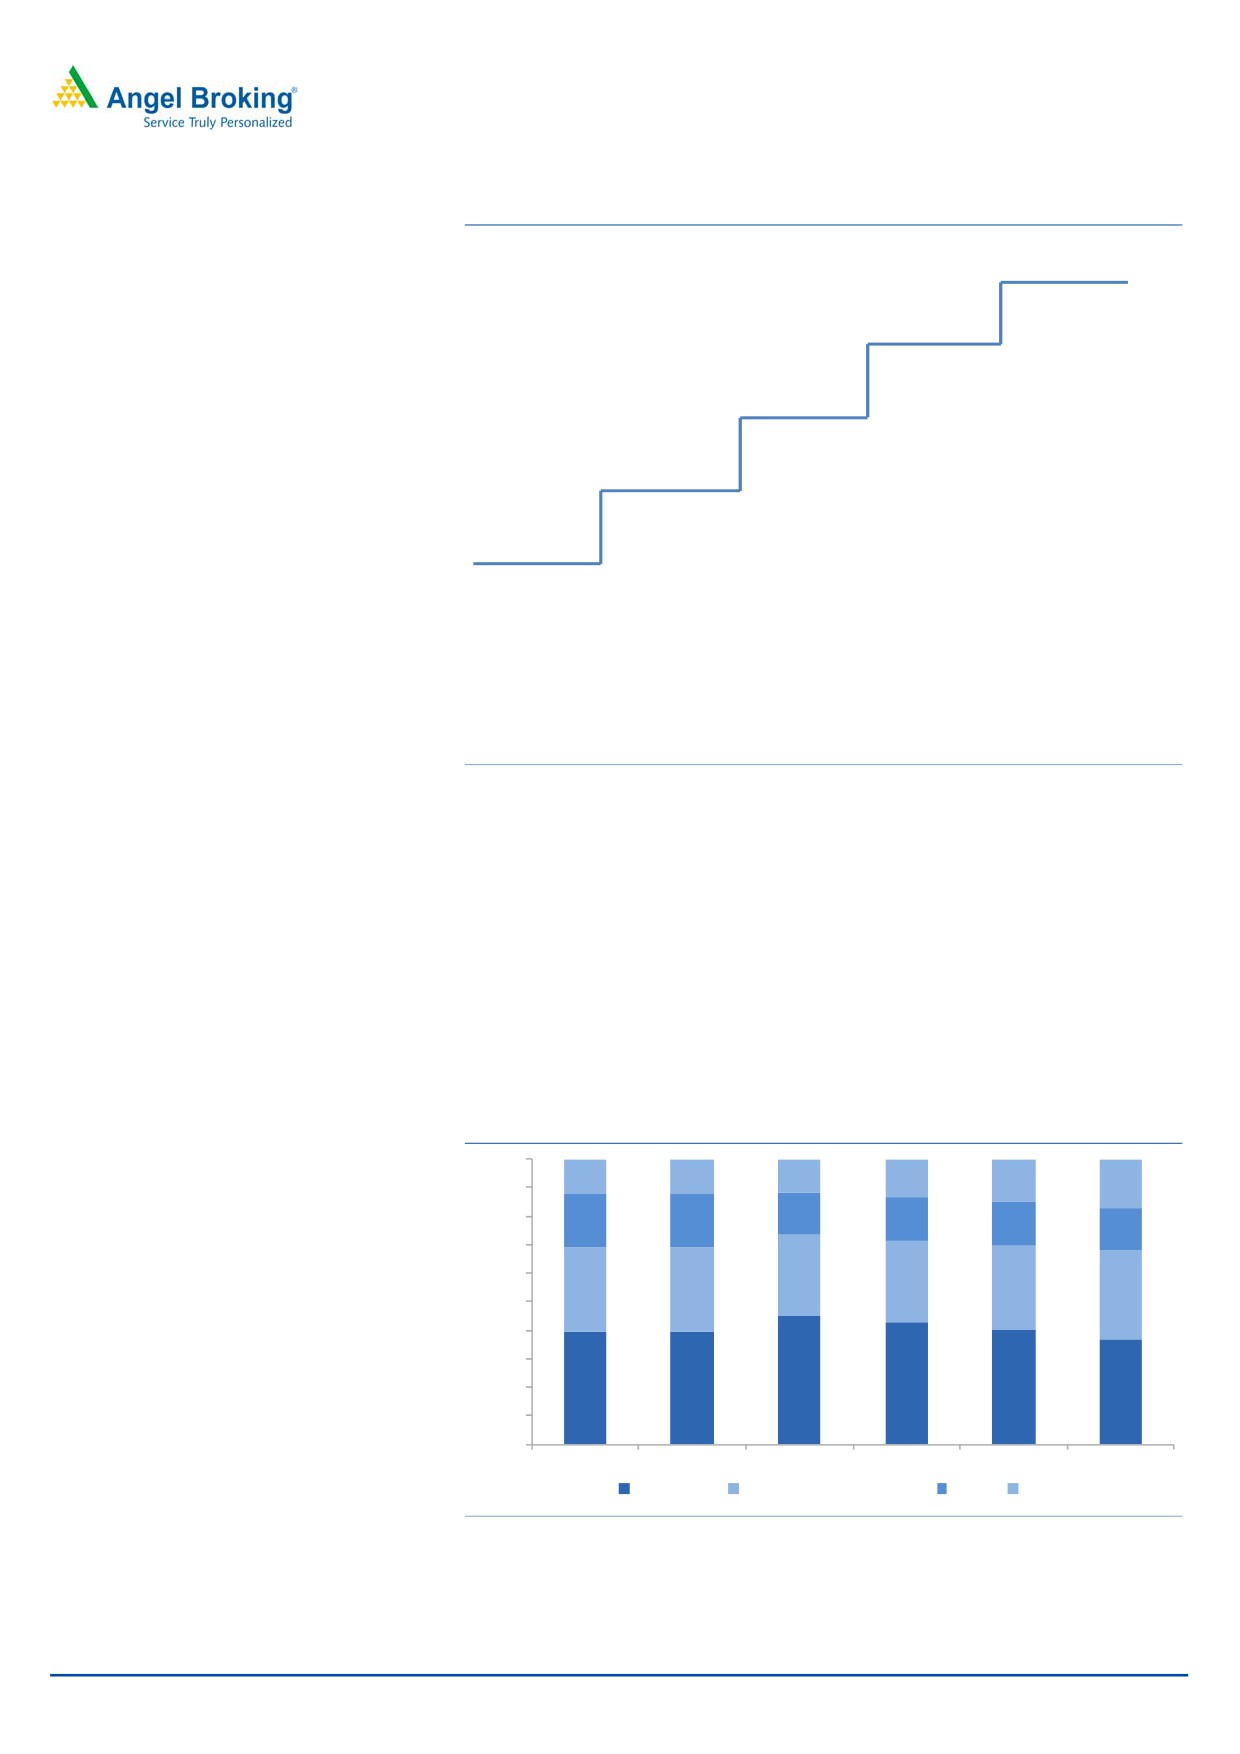
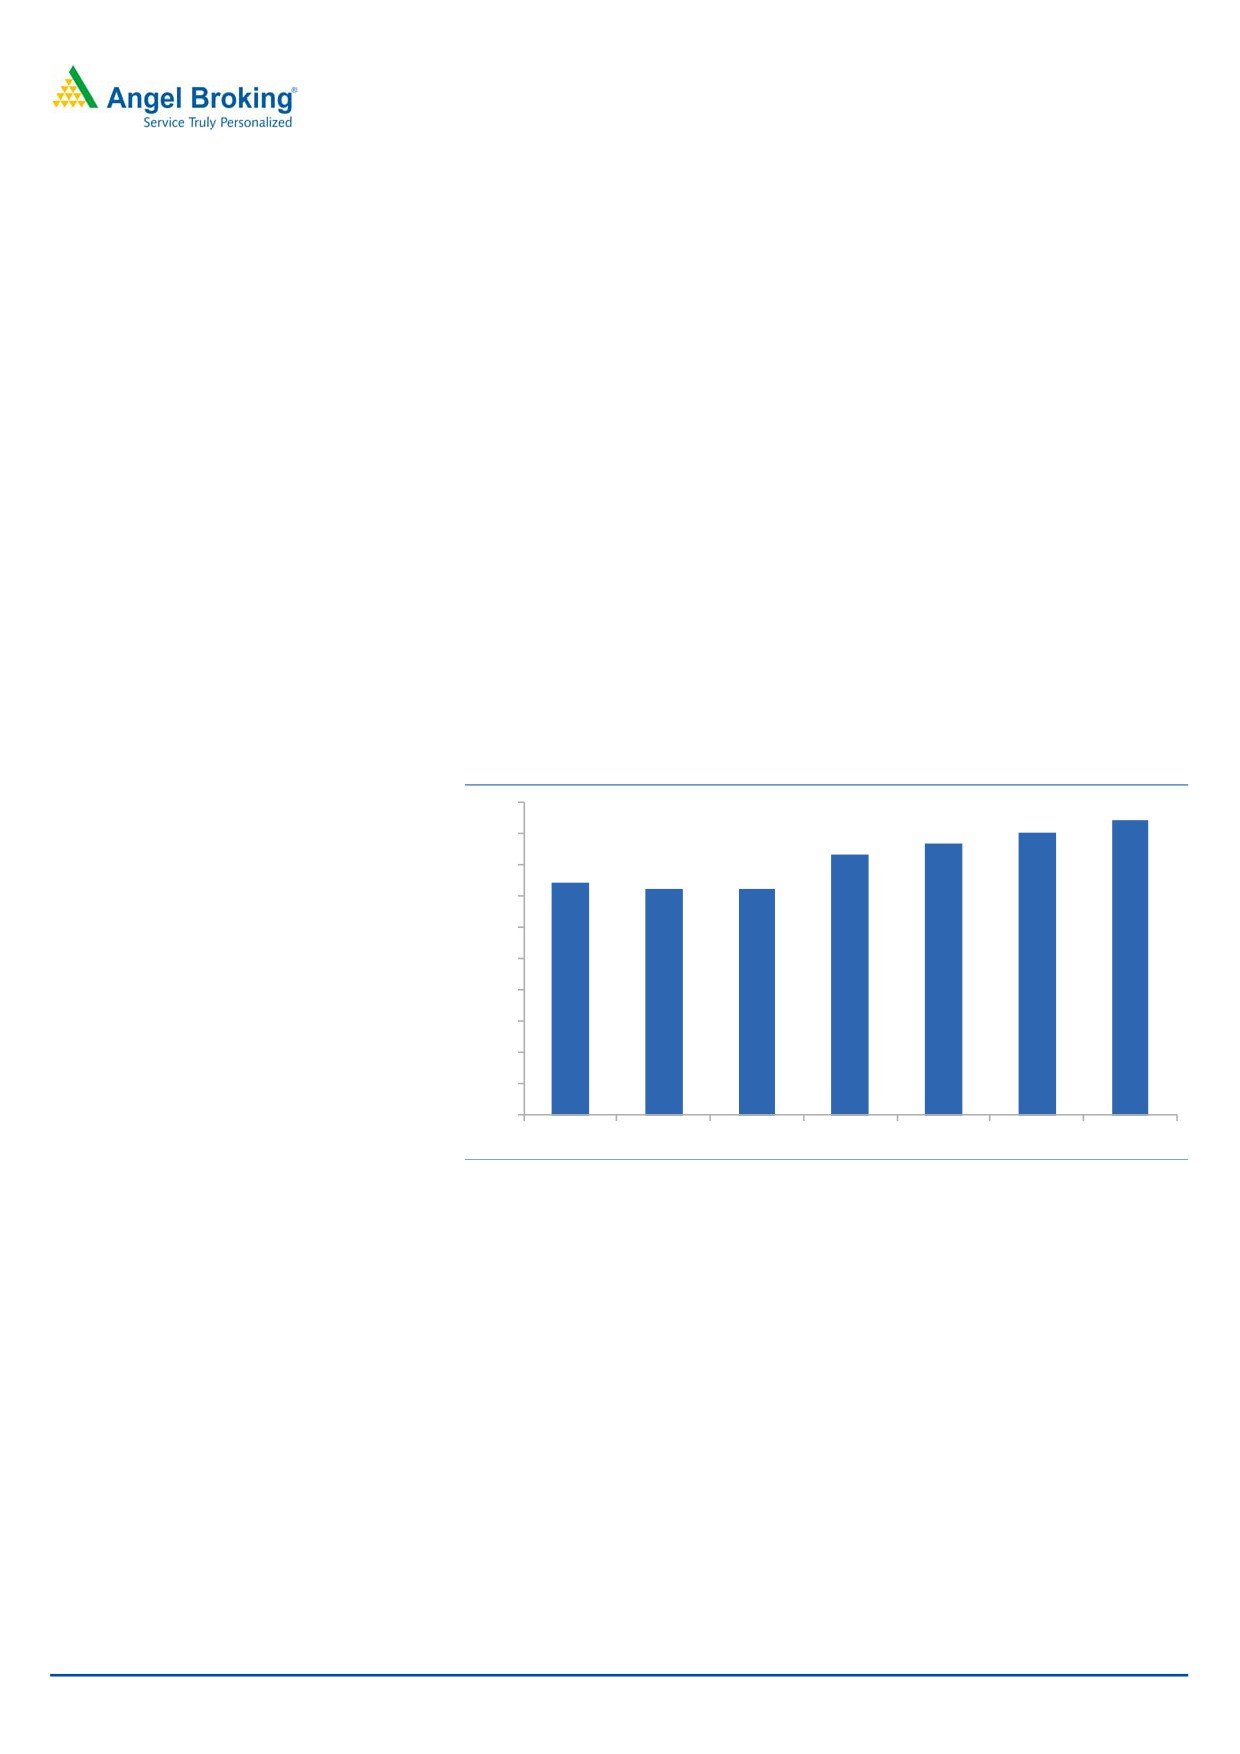
Exhibit 3: Loan Mix (%)
100
13
12
12
13
15
90
17
80
15
19
19
15
15
15
70
60
29
28
29
29
30
31
50
40
30
45
43
20
40
40
40
37
10
0
FY12
FY14
FY15
FY16
FY17E
FY18E
Wholesale
Mid-Commercial & SME
Rural
Retail
Source: Company, Angel Research
November 28, 2016
3
Lakshmi Vilas Bank | Initiating Coverage
The corporate loans (Wholesale) constitute around 43% (FY16) of the bank’s total
loan portfolio and continue to grow moderately by concentrating only top rated
corporate. The bank aims to increase retail/SME segment share as this offer better
yields as well as lower delinquencies. To accomplish target, bank is expanding
their services in calibrated manner beginning with Home loans, mortgages, and
then moving towards two-wheeler and four-wheeler financing. After an
appropriate level of experience, the bank is planning to get into unsecured
financing, including personal loans. To grow retail base at steady rate, bank is
putting together the collection and appraisal mechanism.
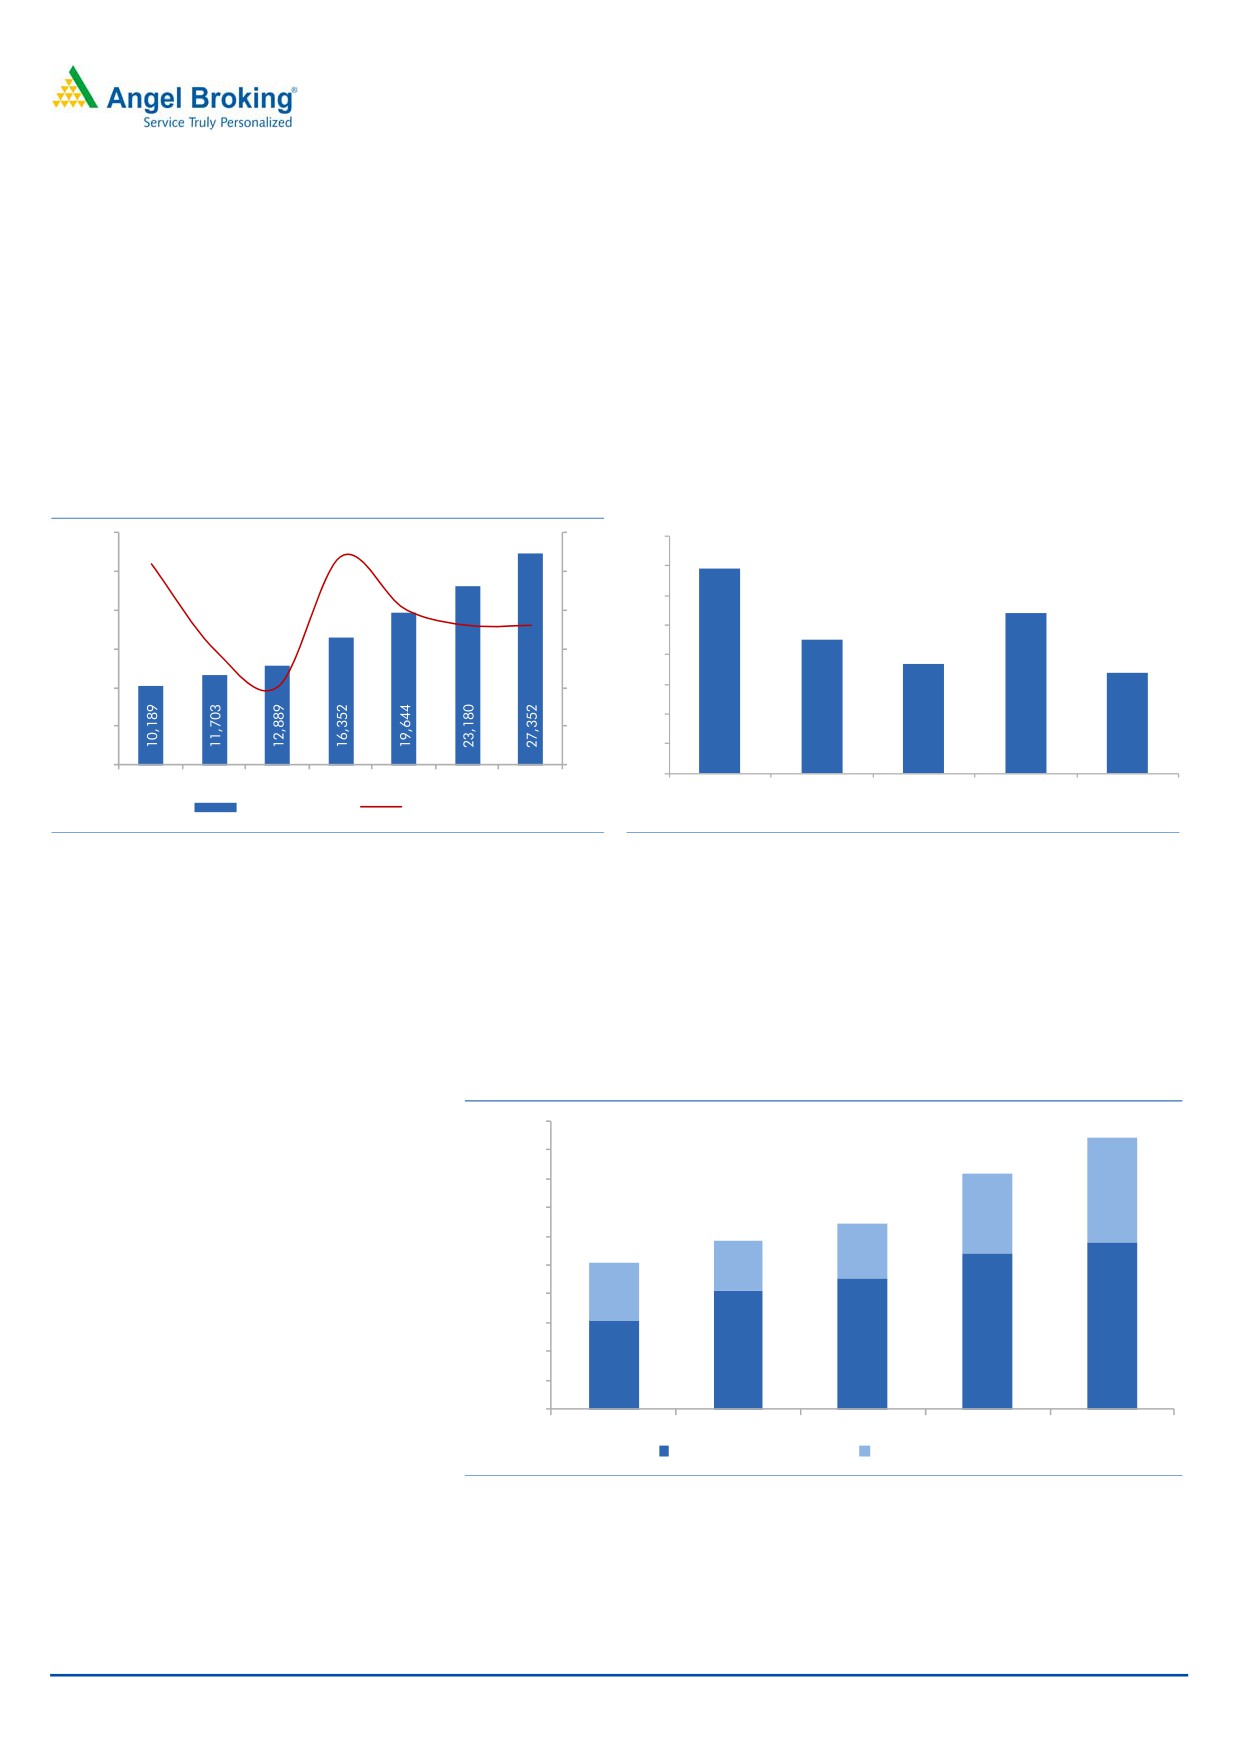
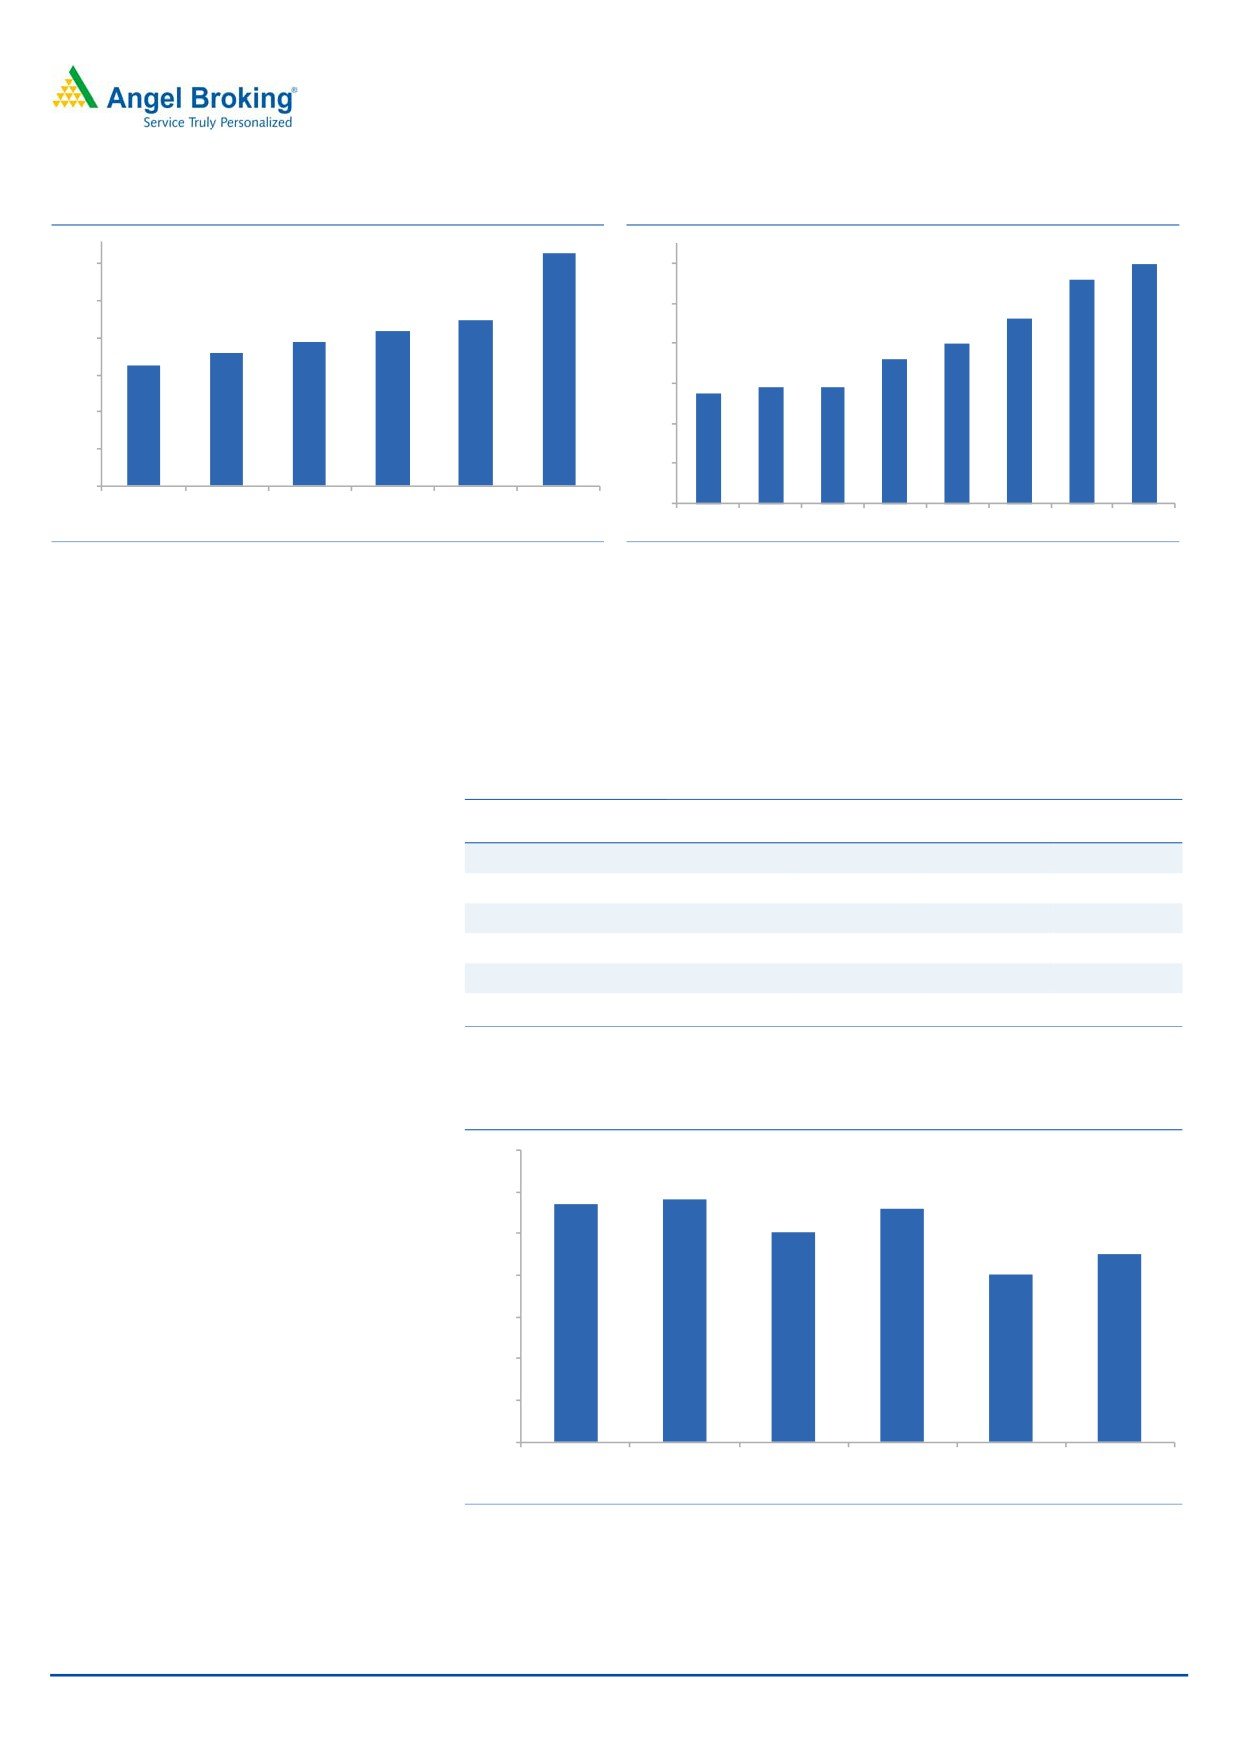
Exhibit 4: Loan Book Growth
Exhibit 5: Comparative - 4 Year CAGR Loan Book Growth
30,000
27
30
20
26
18
18
25,000
25
20
16
15
20,000
18
18
20
15
14
13
15,000
15
11
12
11
10
10,000
10
10
8
5,000
5
6
0
-
4
FY12
FY13
FY14
FY15
FY16
FY17E FY18E
Lakshmi Vilas
KVB
Federal Bank City Union bank South Indian
Advance (` Cr)
Growth (%)
Bank
bank
Source: Company, Angel Research
Source: Company, Angel Research
On SME front, it continues to focus on working capital. As working capital loans
are of shorter duration in nature and backed by cash flows from the business,
asset quality issues are relatively lower. Being a regional bank, it helps to
understand SME risk profile well. This can be leveraged to build SME lending
business with lower delinquency.
Exhibit 6: Working Capital Loan
20,000
18,000
16,000
7,207
14,000
5,580
12,000
3,851
10,000
3,479
8,000
3,993
6,000
11,622
10,772
4,000
8,223
9,038
6,196
2,000
-
FY12
FY13
FY14
FY15
FY16
Working Capital (` Cr) Term Loan (` Cr)
Source: Company, Angel Research
November 28, 2016
4
Lakshmi Vilas Bank | Initiating Coverage
Capital raising likely in 2HFY17
LVB’s tier-1 ratio stands at 8.2% as on Q2FY17. Taking into account the rate at
which the bank is growing and expected to grow, the management indicated that it
will raise ~`500cr of equity capital in 2HFY17. This should support the bank’s
target to grow at 18% for the next two years.
Laying a sustainable foundation of CASA to boost NIM: LVB’s CASA ratio was at
14.9% (FY12) and has grown to 17.36% (FY16). Nevertheless, this is one of the
lowest CASA ratio amongst regional banks. The new management has a slew of
steps to improve CASA ratio by 2% every year for the next two-three years. Steps
taken to improve CASA are: a)Offering competitive interest rate of 5-6 %, which is
higher than industry average on saving accounts, b)Launched new services such as
- Crown, NRI Banking Product, Flexi Current Account - SME, and Debit Card for
Entities, c)Formation of a new position - large business RM to tap salary account
and dedicated team for liability business d)On an average, addition of 70-80
branches over the next three years, and e)Freeing bandwidth at the branch level by
moving the credit appraisal function to the RO/CO level and sales force
incentivises to mobilise liability products.
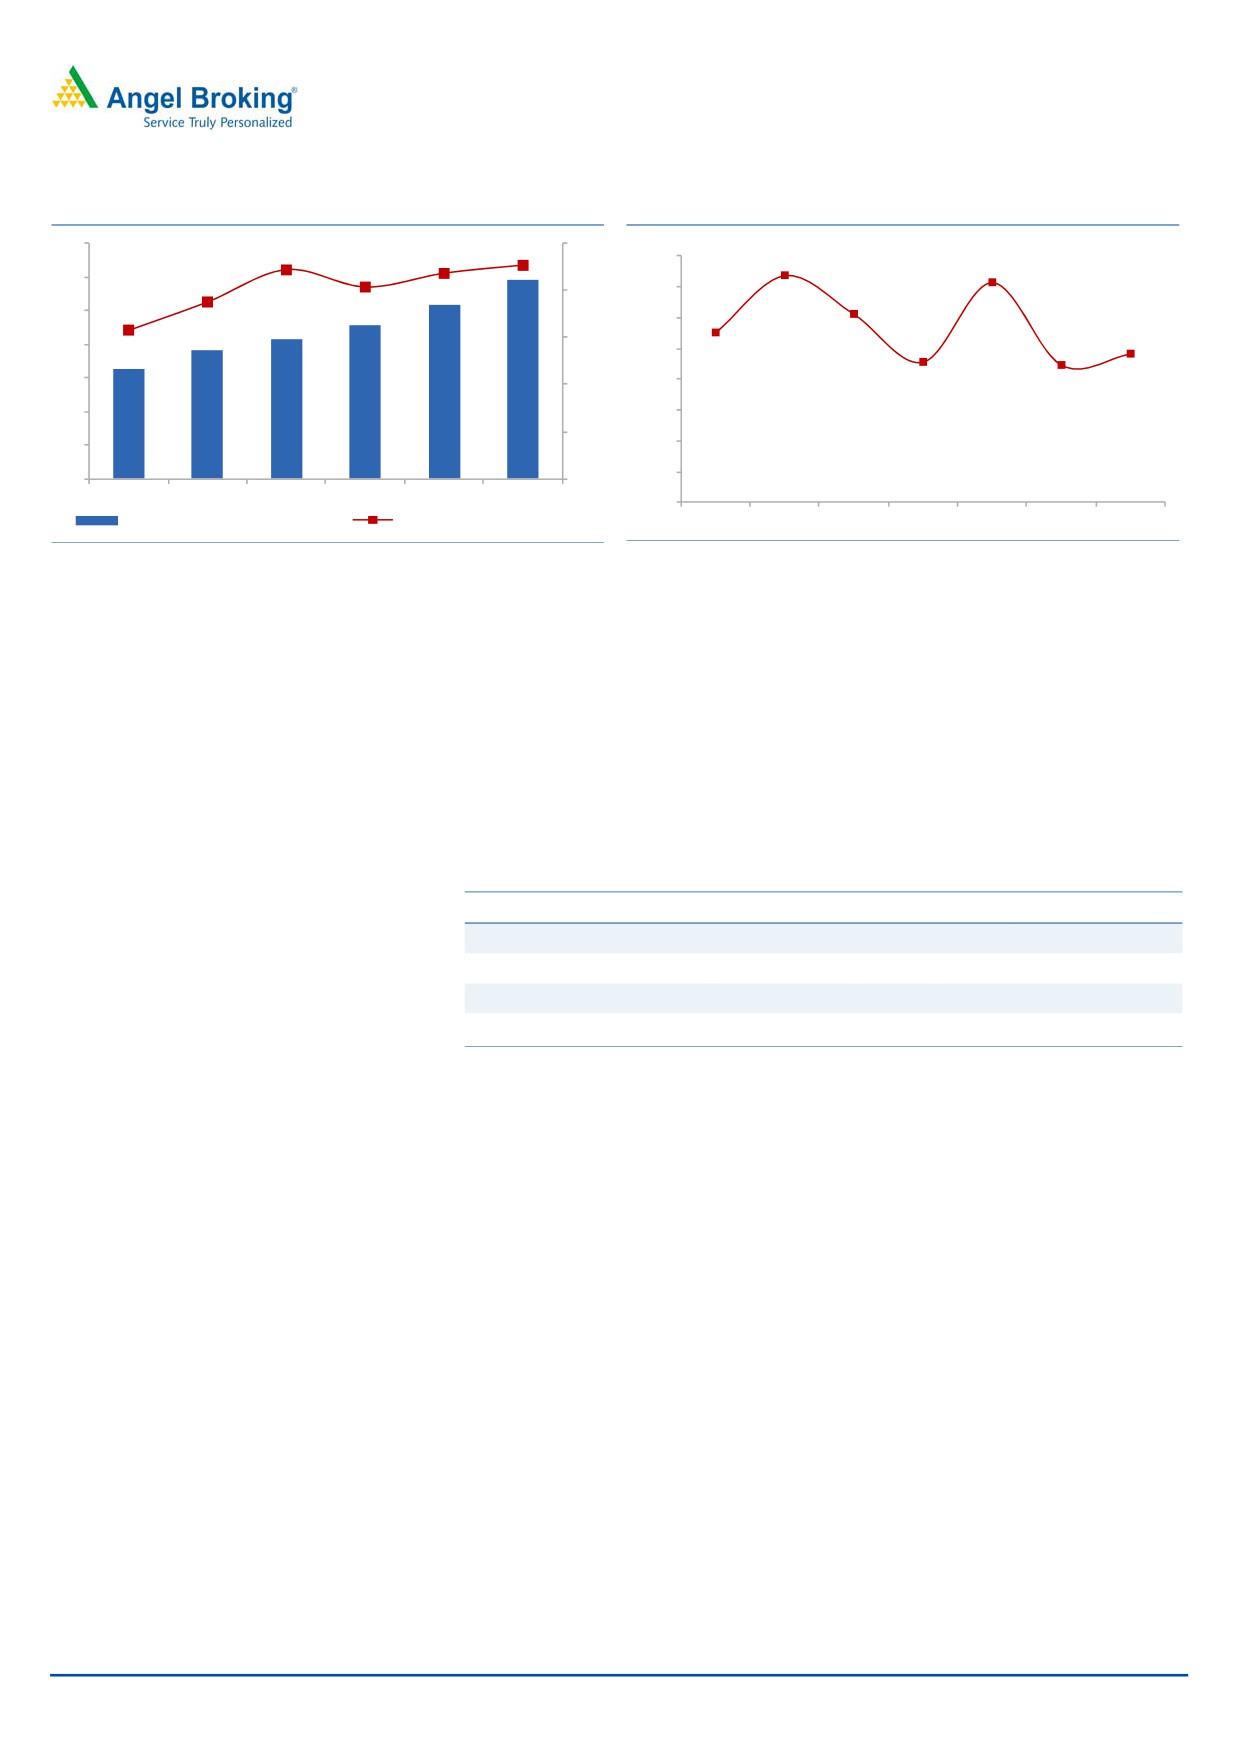
Exhibit 7: LVB - CASA (%)
20.0
18.9
18.1
17.4
18.0
16.7
16.0
14.9
14.5
14.5
14.0
12.0
10.0
8.0
6.0
4.0
2.0
0.0
FY12
FY13
FY14
FY15
FY16
FY17E
FY18E
Source: Company, Angel Research
Exhibit-8 clearly depicts LVB’s Casa (17.4%) ratio which is still lower compared to
regional peers such as Federal Bank Ltd (32.5%), KVB (23.3%), South Indian bank
(22%), and City Union bank (20.4%). Therefore, incumbent management has set
priorities to expand CASA by 2% every year for the next 2-3 years, led by branch
expansion, new customer acquisition, roll-out of new products and superior
technology. Improving share of low-cost CASA is likely to taper LVB’s overall cost
of deposits (which is again higher among peers) resulting stable/improving NIM.
November 28, 2016
5
Lakshmi Vilas Bank | Initiating Coverage
Exhibit 8: Comparative CASA (%) FY16
Exhibit 9: Branch Expansion
32.5
600
31.0
600
560
26.0
23.3
500
460
22.0
20.4
400
21.0
19.0
400
361
17.4
290
291
16.0
274
300
11.0
200
6.0
100
1.0
Lakshmi
RBL
City Union South Indian
KVB
Federal
0
Vilas Bank
bank
bank
Bank
FY11
FY12
FY13
FY14
FY15
FY16
FY17E FY18E
Source: Company, Angel Research
Source: Company, Angel Research
Exhibit-10 shows there is enough scope to improve branch performance; LVB is
at lower end in almost all parameters. New team has been changing the hiring
culture to move towards a professionally run new-age bank. Additionally,
higher focus towards other income would also greatly benefit LVB to reduce
cost/income ratio.
Exhibit 10: Branch Efficiency Comparative (FY16)
Per Branch
Per branch
Per branch
Per Branch
(` Cr)
Business
CASA
Advance
Deposit
Lakshmi Vilas Bank
98
10
43
55
RBL
231
23
108
124
KVB
133
17
58
74
Federal Bank
110
21
46
63
City Union bank
92
11
40
52
South Indian bank
115
15
49
66
Source: Company, Angel Research
Exhibit 11: Comparative (FY16) - Cost/Income (%)
70.0
57.1
58.3
60.0
56.0
50.3
50.0
45.1
40.1
40.0
30.0
20.0
10.0
0.0
Lakshmi Vilas
RBL
KVB
Federal Bank City Union South Indian
Bank
bank
bank
Source: Company, Angel Research
November 28, 2016
6
Lakshmi Vilas Bank | Initiating Coverage
Exhibit 12: Business efficiency
Exhibit 13: Cost/Income (%)
14
89
91
100
87
58.0
57.4
81
57.1
12
75
80
57.0
56.1
12
10
63
55.5
56.0
10
60
54.8
8
9
54.6
54.5
55.0
8
8
6
54.0
7
40
4
53.0
20
2
52.0
51.0
0
0
FY11
FY12
FY13
FY14
FY15
FY16
50.0
Business Per Employee (` Cr)
Business Per Branch (` Cr)
FY12
FY13
FY14
FY15
FY16
FY17E
FY18E
Source: Company, Angel Research
Source: Company, Angel Research
ROA booster- Focus fees income & non funded business: Fees based income
remained very low over a period of time (0.5% of average assets over FY11-16),
which is lower than close peers - City Union bank (~0.75%). With wide experience
in corporate banking, the new MD has taken several steps to extend non-funded
services to SME such as treasury products, letter of credit, and bank guarantees
among others. In addition to this, third-party distribution fees will also contribute to
fees income. The new management’s target is to reach at 25% of total income in
FY26 from 11% in FY16.
Exhibit 14: Comparative of Non-fund based exposures, FY16
As % Of Total Asset
LVB
CUB KVB Federal
RBL Yes bank
Acceptances, Endorsement
4.4
1.1
4.1
1.4
3.3
15.6
Guarantees given
3.5
6.2
5.3
4.8
12.7
10.8
Forward Exchange Contracts
4.0
15.3
8.4
15.6
23.4
106.9
Total contingent liability
12.8
20.8
18.0
22.2
75.9
200.4
Source: Company, Angel Research
Better placed ALM, supported by retail deposit
LVB’s ALM is better placed as majority of its deposits (84.23%) and advances
(84.65%) are maturing up to 3 years. Similarly, maturity bucket in ALM helps bank
to maintain stable margin (NIM) as it is able to pass on deposit rate hike/decline to
borrowers.
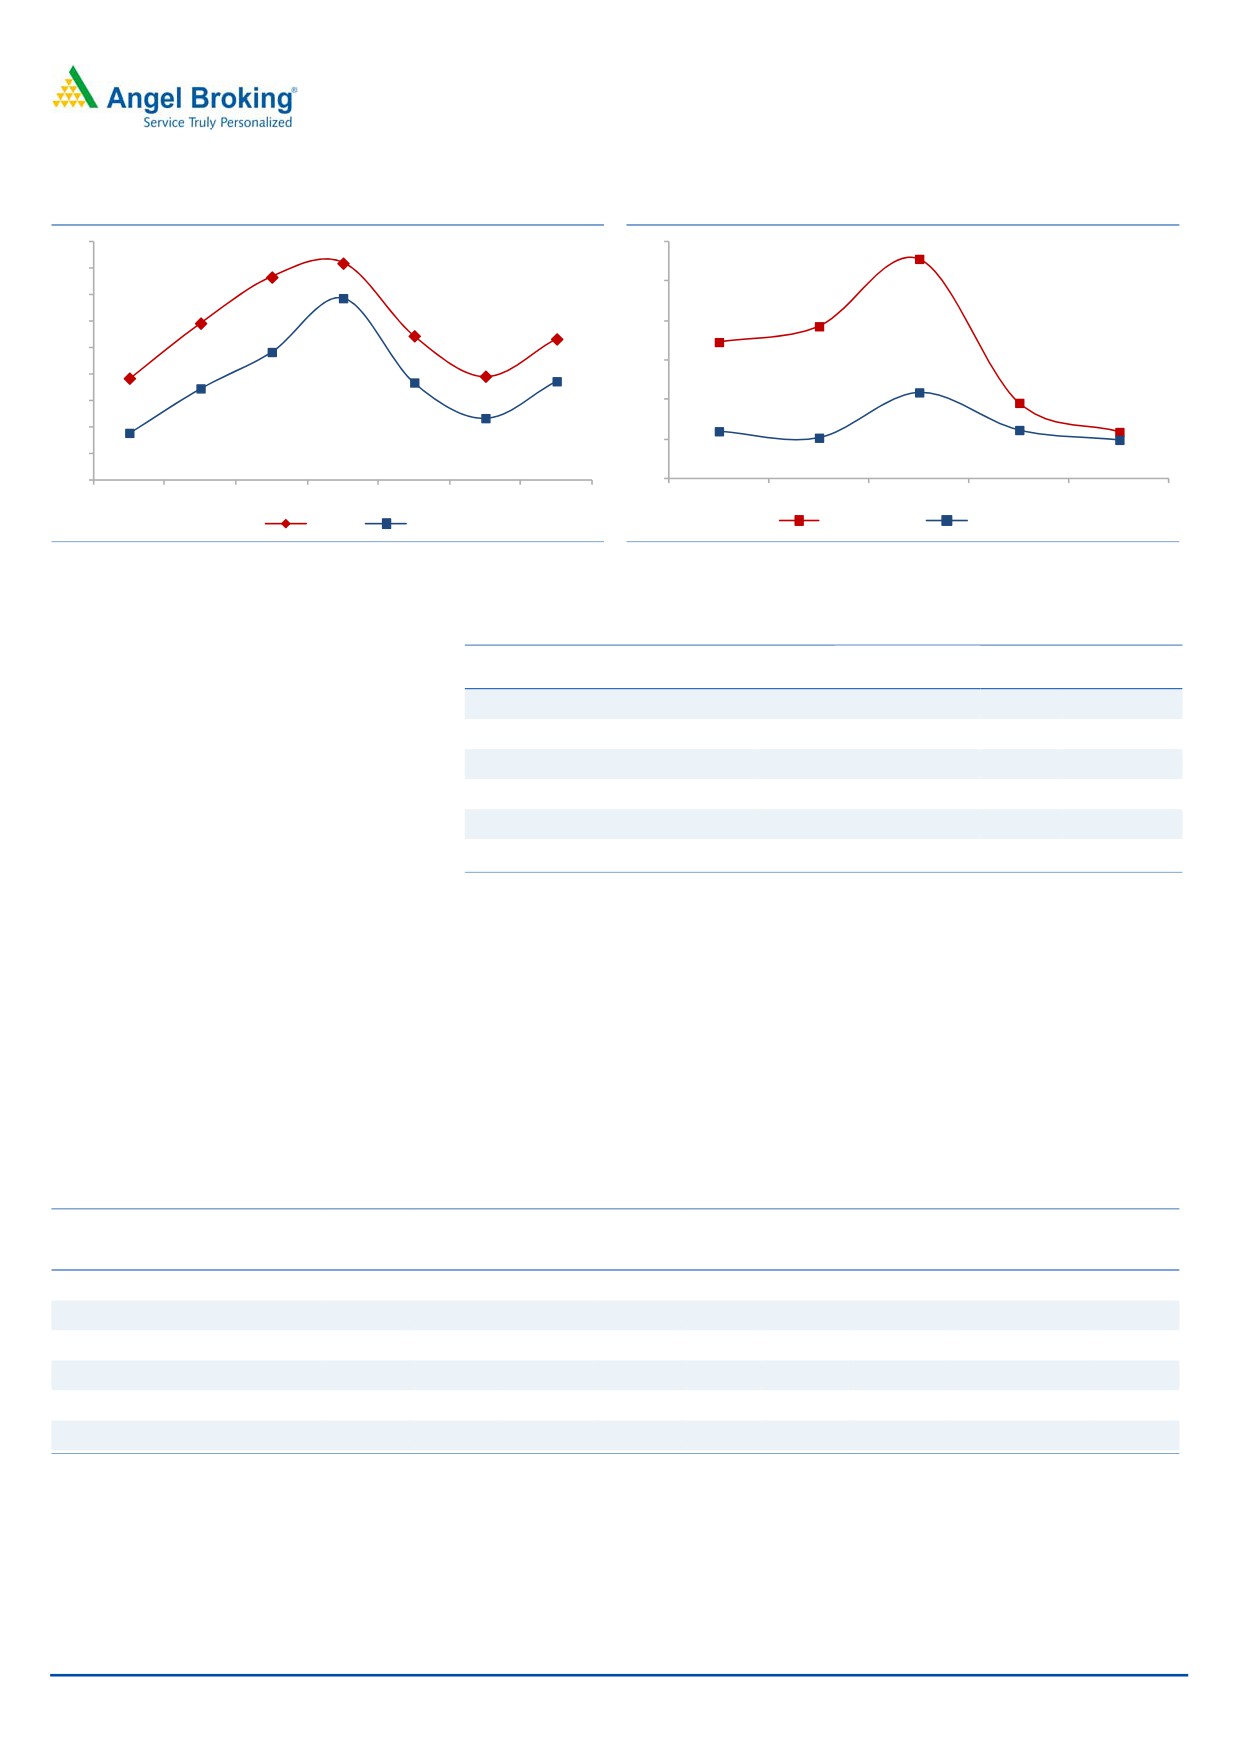
Asset Quality
The bank has lent aggressively to corporate and registered high growth during
2009 to 2012. This led to spike in stress advance over FY13-14 as large part of
loans were lent to mid-corporate, which were badly hit by economic downturn.
GNPA peaked at 4.1% (FY14) from 1.9% (FY11). The bank has taken majority of
accounted stress assets, either NPA or sold to ARC. After 2014, GNPA/NPA has
constantly reduced. However, in Q2FY17, GNPA/ NPA increased moderately to
2.7%/1.9%, owing to one bill discounting fraud. We believe, going forward, the
asset quality to gradually improve considering alteration in lending decision.
November 28, 2016
7
Lakshmi Vilas Bank | Initiating Coverage
Exhibit 15: GNPA & NPA (%)
Exhibit 16: Slippages & Credit Cost (%)
4.5
4.1
6.0
5.6
3.8
4.0
5.0
3.5
3.0
3.4
3.9
2.7
2.7
3.0
4.0
3.5
2.5
2.4
2.0
1.9
3.0
2.0
1.8
1.9
1.9
1.7
1.5
2.0
2.2
1.2
1.2
1.0
0.9
1.0
0.5
1.2
1.2
1.0
1.0
0.0
0.0
FY11
FY12
FY13
FY14
FY15
FY16
1HFY17
FY12
FY13
FY14
FY15
FY16
GNPA
NPA
Slippages (%)
Credit Cost (%)
Source: Company, Angel Research
Source: Company, Angel Research
Exhibit 17: Comparative - Asset Quality
Total Stressed
FY16 (%)
NPA
PCR
Slippages
Asset
Lakshmi Vilas Bank
1.2
5.0
69
1.2
RBL
0.6
0.4
56
1.4
KVB
0.6
3.5
82
3.1
Federal Bank
1.7
2.6
72
3.7
City Union bank
1.5
1.4
60
2.4
South Indian bank
2.9
3.2
40
4.3
Source: Company, Angel Research
Outlook & Valuation
We believe that scaling up of the liability franchise led by CASA, higher
contribution from other incomes and prudence approach to alleviate bad loans
will drive profitability and propel return ratio (FY18E-ROE - 12.7% & RoA - 0.72).
This can drive further re-rating. At the current market price, the stock is trading at
1.25x its FY2018E BV of `116. We recommend a Buy rating on the stock, with a
target price of `174 (1.50x FY2018E BV).
Exhibit 18: Comparative table
P/BV*
ROE*
ROA*
4 CAGR
FY18E
FY16
FY17E
FY18E
FY16
FY17E
FY18E Loan growth (%) NPA (%)
Lakshmi Vilas Bank
1.2
10.9
11.2
12.7
0.68
0.66
0.72
18
1.2
RBL
2.6
11.2
12.3
13.9
0.83
0.96
1.04
51
0.6
KVB
0.9
12.9
12.1
14.2
1.02
0.93
1.04
13
0.6
Federal Bank
1.2
6.0
9.5
11.6
0.55
0.82
0.92
11
1.7
City Union bank
2.0
15.5
15.7
16.6
1.50
1.54
1.60
15
1.5
South Indian bank
0.6
9.0
10.7
12.2
0.55
0.63
0.70
11
2.9
Source: Company, Angel Research, Note: CMP as of November 23, 2016, * other bank Consensus taken from Bloomberg,
November 28, 2016
8
Lakshmi Vilas Bank | Initiating Coverage
Exhibit 19: Comparative DuPont Analysis
Federal
City Union
South Indian
FY2016
KVB
RBL
LVB
Bank
bank
bank
NII
3.2
2.9
3.3
2.5
2.5
2.4
Non Interest Income
1.3
0.9
1.4
0.8
1.5
1.1
Total Revenues
4.5
3.8
4.7
3.3
4.0
3.6
Operating Cost
2.3
2.1
1.9
1.9
2.3
2.0
PPP
0.6
0.8
0.8
0.6
0.3
0.7
Total provisions
0.6
0.8
0.8
0.6
0.3
0.7
Pre-Tax Profit
1.7
0.8
2.0
0.8
1.3
0.9
Tax
0.6
0.3
0.5
0.3
0.4
0.2
ROA
1.0
0.5
1.5
0.5
0.9
0.7
Leverage
12.6
11.0
10.3
16.4
12.7
16.1
RoE (%)
12.9
6.0
15.5
9.0
11.2
10.9
Source: Company, Angel Research
Key Risk
High concentration to a single state: LVB derives half of its business from 60%
branch network based in Tamil Nadu alone. Any change in socio political
situation/occurrence of a natural calamity can impact the economic condition of
the borrowers and in turn impact the credit quality of the company.
Standard Restructured: Higher delinquency from standard restructured can
escalate provisioning requirement and hence can impact the return ratio.
Demonetisation: For FY16, LVB loan book consist 26% of Mid Commercial & SME.
Post demonetization, higher slippages from SME loan Book may dent profitability.
Company background
Lakshmi Vilas Bank is a south based private sector bank with major business
(50.2%) concentrated in the state of Tamil Nadu. Currently, LVB has a network of
463 branches (plus 7 extension counters) pan India and 926 ATMs. The extensive
branch network (60%) in Tamil Nadu, which is one of the more progressive and
industrialized states in the country, provides a solid market base of business and
customers.
Key Management Personnel
The top management team comprises of Mr. Parthasarathi Muhkerjee, supported
by Mr. M. Palaniappan - Chief Financial officer, Mr. AJ Vidyasagar - CGM &
COO, and Mr. RM Meenakshi Sundaram - Chief General Manager of Whole Sale
Banking and General Managers.
November 28, 2016
9
Lakshmi Vilas Bank | Initiating Coverage
Income Statement
Y/E March (` cr)
FY14
FY15
FY16
FY17E
FY18E
NII
486
527
645
777
914
- YoY Growth (%)
24.0
8.4
22.5
20.4
17.6
Other Income
218
284
305
414
462
- YoY Growth (%)
10.6
30.3
7.2
35.9
11.6
Operating Income
704
811
950
1,191
1,376
- YoY Growth (%)
19.5
15.2
17.2
25.4
15.5
Operating Expenses
395
442
543
648
754
- YoY Growth (%)
16.9
12.0
22.7
19.5
16.3
Pre - Provision Profit
309
368
407
542
621
- YoY Growth (%)
23.0
19.2
10.5
33.2
14.6
Prov. & Cont.
269
180
177
269
269
- YoY Growth (%)
136.9
(32.9)
(2.0)
52.5
0.0
Profit Before Tax
40
188
231
273
352
- YoY Growth (%)
(70.7)
366.0
22.5
18.4
29.0
Prov. for Taxation
(20)
56
50
68
99
- YoY Growth (%)
-
-
(10.6)
36.5
44.5
PAT
60
132
181
205
254
- YoY Growth (%)
(34.4)
120.2
36.5
13.4
23.8
Balance Sheet
Y/E March (` cr)
FY14
FY15
FY16
FY17E
FY18E
Share Capital
98
179
179
179
179
Reserve & Surplus
956
1,377
1,584
1,727
1,905
Net Worth
1,054
1,556
1,764
1,907
2,084
Deposits
18,573
21,964
25,431
29,246
33,632
- YoY Growth (%)
18.9
18.3
15.8
15.0
15.0
Borrowing
458
458
723
847
975
Other Lia & Prov
568
727
815
930
1,100
Total Liabilities
20,653
24,705
28,732
32,930
37,792
Cash and Bal with RBI
1,192
1,143
1,287
1,367
1,493
Bal With BANK
120
175
82
137
157
Investment
5,689
6,051
6,545
7,108
7,860
Advance
12,889
16,352
19,644
23,180
27,352
- YoY Growth (%)
10.1
26.9
20.1
18.0
18.0
Fixed Asset
201
243
367
410
456
Other Asset
563
740
807
728
474
Total Asset
20,653
24,705
28,732
32,930
37,792
Growth (%)
16.9
19.6
16.3
14.6
14.8
November 28, 2016
10
Lakshmi Vilas Bank | Initiating Coverage
Ratio Analysis
Y/E March
FY14
FY15
FY16
FY17E
FY18E
Data Per Share
EPS
6.2
7.4
10.1
11.4
14.1
BV
108
87
98
106
116
Adj BV
80.5
76.8
88.4
91.3
101.1
Profitability ratio
NIM
2.8
2.6
2.6
2.7
2.8
Cost to Income
56.1
54.7
57.1
54.5
54.8
RoA
0.31
0.58
0.68
0.66
0.72
RoE
5.8
10.1
10.9
11.2
12.7
B/S ratios (%)
CASA Ratio
14.2
16.7
17.4
18.1
18.9
Credit/Deposit
71.9
72.1
75.9
78.3
80.4
Asset Quality
GNPA
4.1
2.7
2.0
2.0
1.7
NPA
3.4
1.8
1.2
1.1
0.9
Slippages
5.6
1.9
1.2
2.1
1.7
Credit Cost
2.2
1.2
1.0
1.3
1.1
Valuation
PER
23.5
19.6
14.4
12.7
10.3
P/ABVPS
1.8
1.9
1.6
1.6
1.4
Div Yield
0.7
1.4
2.1
2.4
2.9
Du Pont Analysis
FY14
FY15
FY16
FY17E
FY18E
NII
2.5
2.3
2.4
2.5
2.6
Non Interest Income
1.1
1.3
1.1
1.3
1.3
Total Revenues
3.7
3.6
3.6
3.9
3.9
Operating Cost
2.1
2.0
2.0
2.1
2.1
PPP
1.6
1.6
1.5
1.8
1.8
Total provisions
1.4
0.8
0.7
0.9
0.8
TreTax Profit
0.2
0.8
0.9
0.9
1.0
Tax
(0.1)
0.2
0.2
0.2
0.3
ROA
0.3
0.6
0.7
0.7
0.7
Leverage
18.5
17.4
16.1
16.8
17.7
RoE (%)
5.8
10.1
10.9
11.2
12.7
Source: Company, Angel Research
November 28, 2016
11
Lakshmi Vilas Bank | Initiating Coverage
Research Team Tel: 022 - 39357800
DISCLAIMER
Angel Broking Private Limited (hereinafter referred to as “Angel”) is a registered Member of National Stock Exchange of India Limited,
Bombay Stock Exchange Limited and Metropolitan Stock Exchange Limited. It is also registered as a Depository Participant with CDSL
and Portfolio Manager with SEBI. It also has registration with AMFI as a Mutual Fund Distributor. Angel Broking Private Limited is a
registered entity with SEBI for Research Analyst in terms of SEBI (Research Analyst) Regulations, 2014 vide registration number
INH000000164. Angel or its associates has not been debarred/ suspended by SEBI or any other regulatory authority for accessing
/dealing in securities Market. Angel or its associates/analyst has not received any compensation / managed or co-managed public
offering of securities of the company covered by Analyst during the past twelve months.
This document is solely for the personal information of the recipient, and must not be singularly used as the basis of any investment
decision. Nothing in this document should be construed as investment or financial advice. Each recipient of this document should
make such investigations as they deem necessary to arrive at an independent evaluation of an investment in the securities of the
companies referred to in this document (including the merits and risks involved), and should consult their own advisors to determine
the merits and risks of such an investment.
Reports based on technical and derivative analysis center on studying charts of a stock's price movement, outstanding positions and
trading volume, as opposed to focusing on a company's fundamentals and, as such, may not match with a report on a company's
fundamentals. Investors are advised to refer the Fundamental and Technical Research Reports available on our website to evaluate the
contrary view, if any.
The information in this document has been printed on the basis of publicly available information, internal data and other reliable
sources believed to be true, but we do not represent that it is accurate or complete and it should not be relied on as such, as this
document is for general guidance only. Angel Broking Pvt. Limited or any of its affiliates/ group companies shall not be in any way
responsible for any loss or damage that may arise to any person from any inadvertent error in the information contained in this report.
Angel Broking Pvt. Limited has not independently verified all the information contained within this document. Accordingly, we cannot
testify, nor make any representation or warranty, express or implied, to the accuracy, contents or data contained within this document.
While Angel Broking Pvt. Limited endeavors to update on a reasonable basis the information discussed in this material, there may be
regulatory, compliance, or other reasons that prevent us from doing so.
This document is being supplied to you solely for your information, and its contents, information or data may not be reproduced,
redistributed or passed on, directly or indirectly.
Neither Angel Broking Pvt. Limited, nor its directors, employees or affiliates shall be liable for any loss or damage that may arise from
or in connection with the use of this information.
Disclosure of Interest Statement
Lakshmi Vilas Bank
1. Financial interest of research analyst or Angel or his Associate or his relative
No
2. Ownership of 1% or more of the stock by research analyst or Angel or associates or relatives
No
3. Served as an officer, director or employee of the company covered under Research
No
4. Broking relationship with company covered under Research
No
Ratings (Based on expected returns
Buy (> 15%)
Accumulate (5% to 15%)
Neutral (-5 to 5%)
over 12 months investment period):
Reduce (-5% to -15%)
Sell (< -15)
November 28, 2016
12